背景

线上突然出现很多的异常,发现是普罗米休斯在采集指标的时候设置的时间太短,倒是10s之内还没有返回消息直接断开连接导致的异常

  1. 注解@WebEndpoint(id = "prometheus")标识在PrometheusScrapeEndpoint上面,其实@WebEndpoint 就相当于声明成一个@RestController的控制类。

  2. 当/actuator/prometheus请求进来之后就会请求到PrometheusScrapeEndpoint里面,我们可以看到在scrape方法上有个@ReadOperation(producesFrom = TextOutputFormat.class)注解


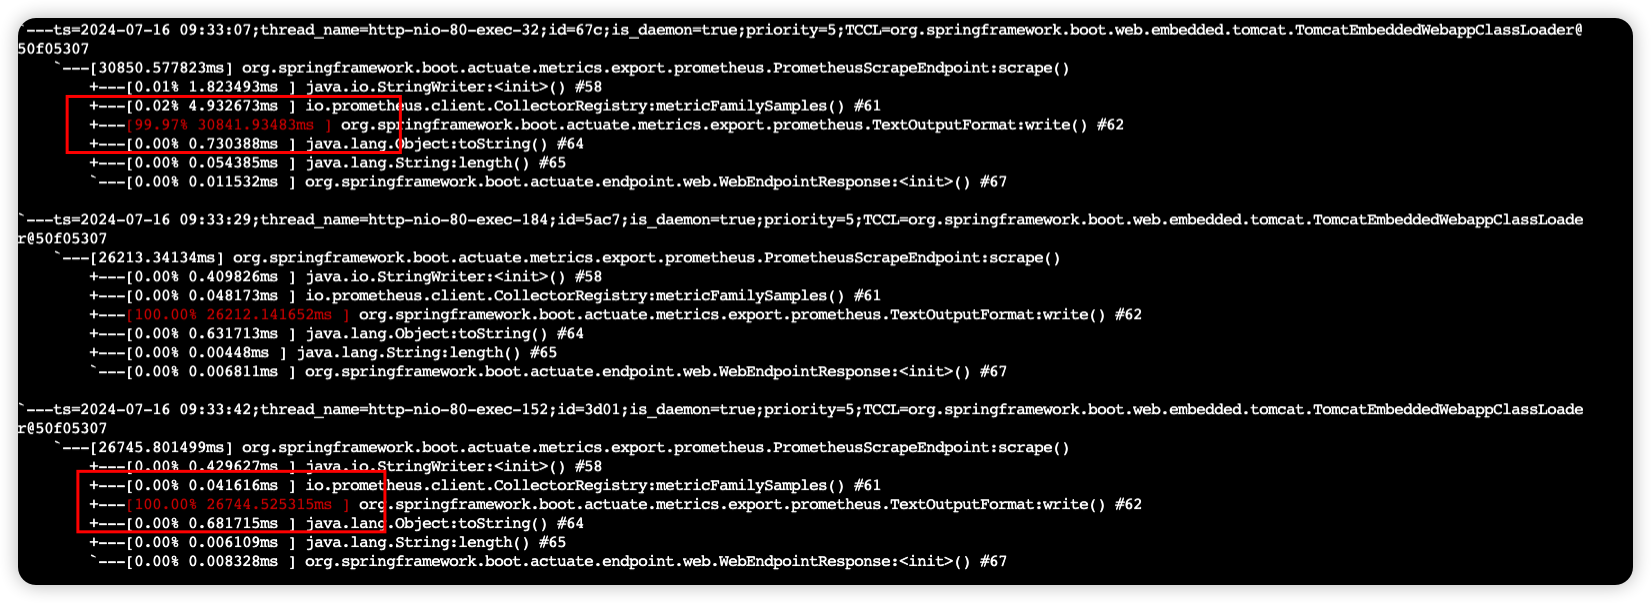
    /**
    * {@link Endpoint @Endpoint} that outputs metrics in a format that can be scraped by the
    * Prometheus server.
    *
    * @author Jon Schneider
    * @author Johnny Lim
    * @since 2.0.0
    */
    @WebEndpoint(id = "prometheus")
    public class PrometheusScrapeEndpoint {

    private static final int METRICS_SCRAPE_CHARS_EXTRA = 1024;

    private final CollectorRegistry collectorRegistry;

    private volatile int nextMetricsScrapeSize = 16;

    public PrometheusScrapeEndpoint(CollectorRegistry collectorRegistry) {
    this.collectorRegistry = collectorRegistry;
    }

    @ReadOperation(producesFrom = TextOutputFormat.class)
    public WebEndpointResponse<String> scrape(TextOutputFormat format, @Nullable Set<String> includedNames) {
    try {
    Writer writer = new StringWriter(this.nextMetricsScrapeSize);
    Enumeration<MetricFamilySamples> samples = (includedNames != null)
    ? this.collectorRegistry.filteredMetricFamilySamples(includedNames)
    : this.collectorRegistry.metricFamilySamples();
    format.write(writer, samples);

    String scrapePage = writer.toString();
    this.nextMetricsScrapeSize = scrapePage.length() + METRICS_SCRAPE_CHARS_EXTRA;

    return new WebEndpointResponse<>(scrapePage, format);
    }
    catch (IOException ex) {
    // This actually never happens since StringWriter doesn't throw an IOException
    throw new IllegalStateException("Writing metrics failed", ex);
    }
    }

    }
  3. ReadOperation表示接受Get请求,所以当我们请求到/actuator/prometheus时,请求会打到scrape方法,方法里根据过滤条件把当前注册到服务的指标格式化为String返回,prometheus的是格式化为普罗米修斯可以采集到的类型的String。

    curl -o /dev/null -s -w "time_connect: %{time_connect}\ntime_starttransfer: %{time_starttransfer}\ntime_total: %{time_total}\n" "http://IP/prometheus"

    这个Shell的Curl可以统计请求时间
    image-20240716093500141

  4. 直接请求接口发现,此次用时接近30S,通过Arthas的trace指令可以明确查看到在这个方法的执行过程中,什么最耗时。我们可以发现TextOutputFormat:write()在格式化普罗米修斯格式的时候耗时最长。

trace --skipJDKMethod false org.springframework.boot.actuate.metrics.export.prometheus.PrometheusScrapeEndpoint scrape -n 1

image-20240716093530157
再向里抓一下
image-20240716153725715
实际上是掉用了CONTENT_TYPE_004里面重写的write方法

trace --skipJDKMethod false io.prometheus.client.exporter.common.TextFormat write004 -n 1

image-20240716153853283
image-20240716153929470

这个是时间最长的 java.util.Enumeration:nextElement() 找下一个元素的时候耗费时间最长,其实可以理解为需要采集的指标太多,所以时间过长

优化手段

  1. 对返回的普罗米修斯指标进行过滤,因为我们的采集平台也没有采集这么多信息。

  2. 通过编写MeterFilter,让采集器过滤这些指标

    /**
    * 过滤掉一些监控的指标
    * 减少prometheus端口的响应时间
    */
    @Configuration
    public class MeterConfig {
    static Set<String> ignorgMeterSet = new HashSet<>();

    static {
    ignorgMeterSet.add("resilience4j.bulkhead.thread.pool.size");
    //.....
    }

    @Bean
    public MeterFilter denySpecificMeter() {
    return MeterFilter.deny(id -> ignorgMeterSet.contains(id.getName()));
    }
    }
  3. 对于无用的resilience4j.bulkhead.thread.pool.size指标,我们在注入了这个MeterFilter之后,Meter在生成指标的时候就会过滤掉这些指标。

    image-20240716091530024

    优化后再次请求,时间到了2.4S(运行15.8H之后)


经过一段时间之后,发现接口还是慢,并且通过Arthas分析发现应该是某个指标导致
img
这一个方法有个min和max,掉84次有一次就占了40s,应该就是这一个指标出的问题
通过Arthas继续分析

watch java.util.Enumeration nextElement '{params,returnObj,throwExp}'  -n 15  -x 3 '#cost>2000'

查看nextElement这个方法的入参和出参,并且过滤速度大于2000ms的请求。
根据结果可以看的出来,是jvm_threads_peak_threads(自Java虚拟机启动或重置峰值以来的活动线程峰值)指标有问题,但是该指标并不应该会有这么慢
image-20240718140055755

随后对这个方法加了日志,重写Prometheus的write004方法,统计一个指标所需要的时间。
该类是第三方Jar包里的,如何重写这个方法加上日志呢?
类路径io.prometheus.client.exporter.common,直接在Springboot的启动类的模块里新建一个相同类路径的package,maven在打包的时候就会把咱们复写的类加载进去,实现重写的方法。
image-20240722134503955
image-20240722135312734
又system_cpu_usage和tomcat_threads_busy_threads出现了时间过长的情况
先排查tomcat_threads_busy_threads为什么慢
找到指标注册的地方
image-20240722135800327
找到该指标方法执行处

stack org.apache.tomcat.util.net.AbstractEndpoint getCurrentThreadsBusy  -n 5 

打一下这个方法的调用堆栈

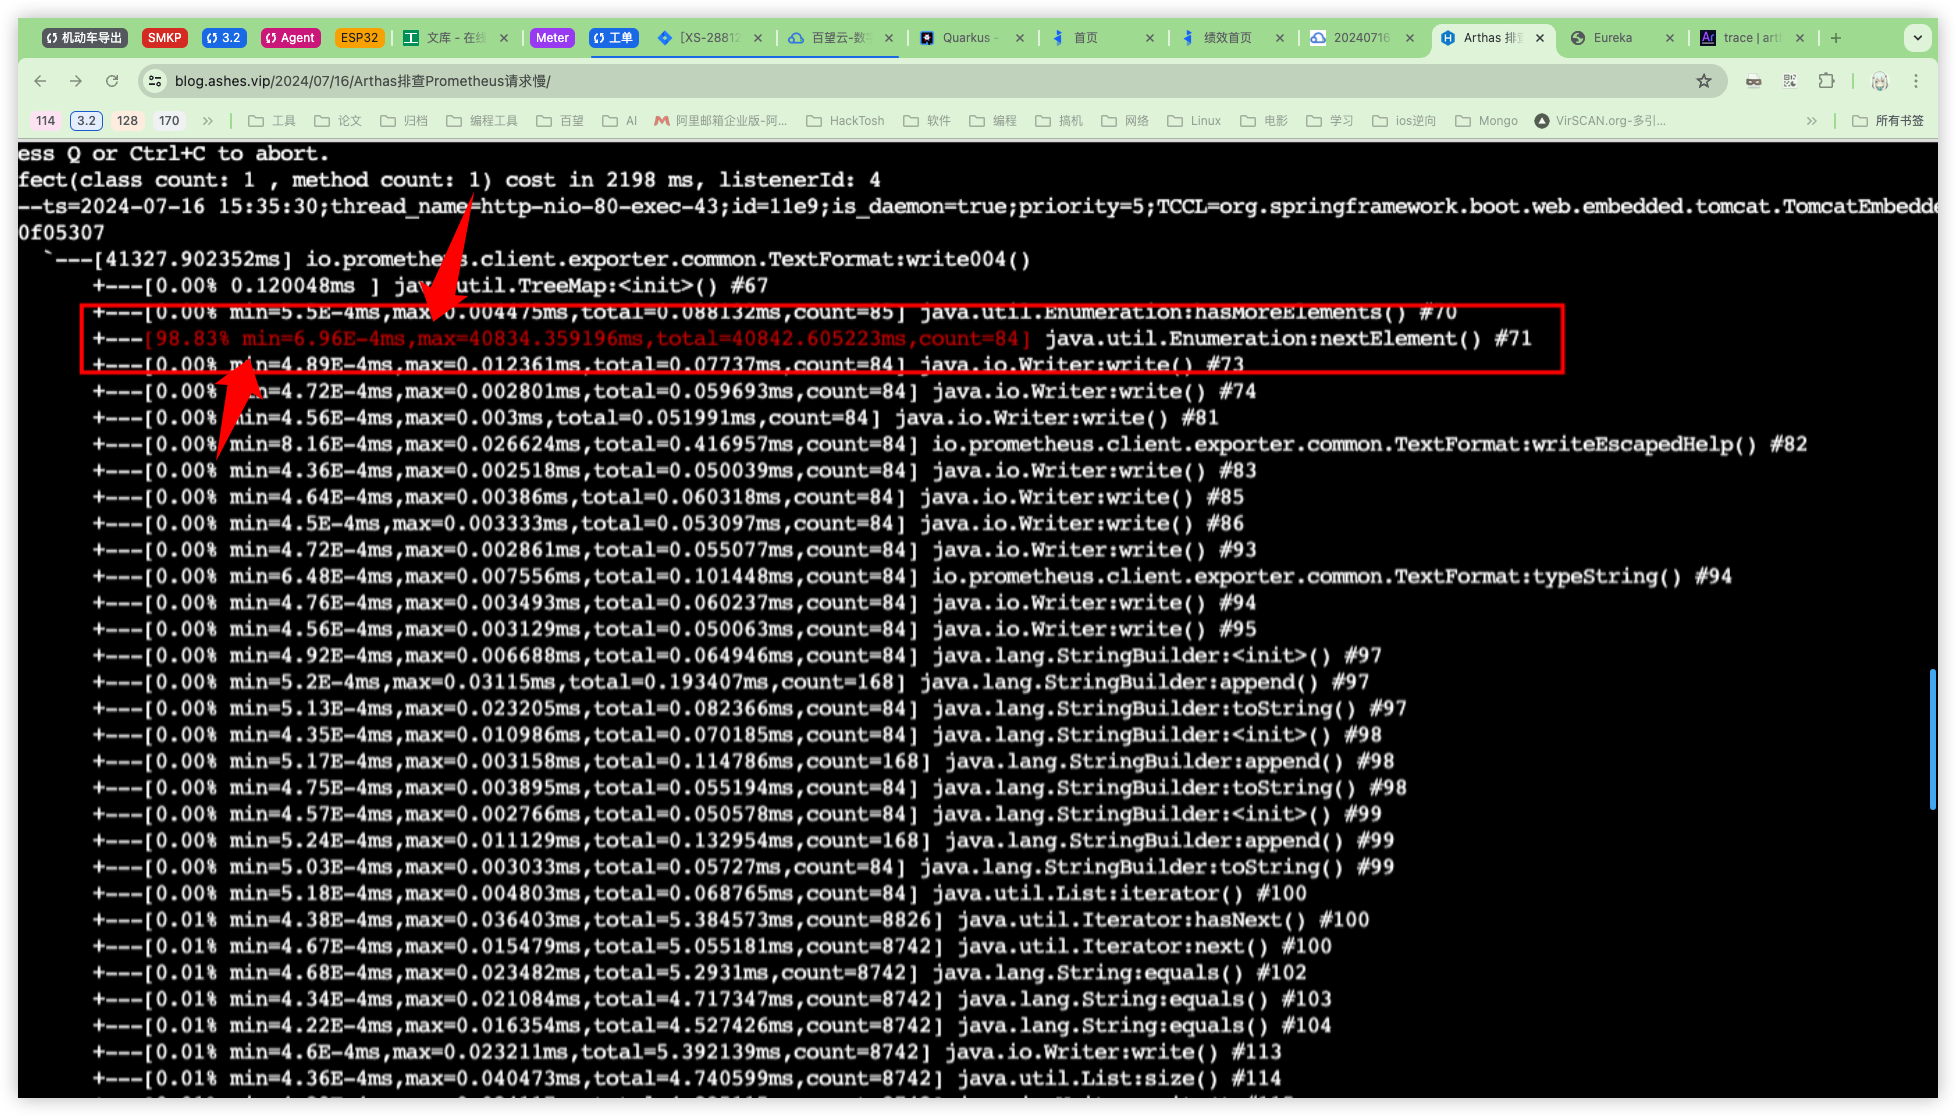
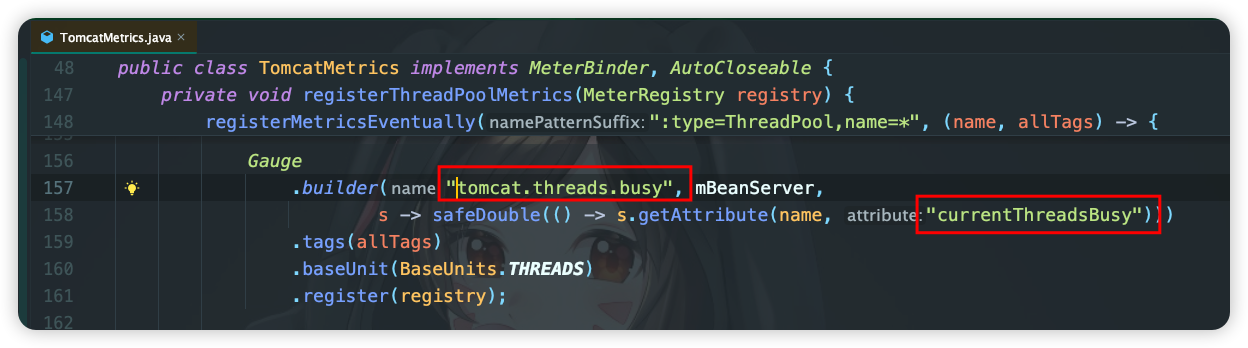
Affect(class count: 3 , method count: 1) cost in 1768 ms, listenerId: 8
ts=2024-07-18 14:33:26;thread_name=http-nio-80-exec-151;id=90cf;is_daemon=true;priority=5;TCCL=org.springframework.boot.web.embedded.tomcat.TomcatEmbeddedWebappClassLoader@2a6dbb7c
@org.apache.tomcat.util.net.AbstractEndpoint.getCurrentThreadsBusy()
at sun.reflect.NativeMethodAccessorImpl.invoke0(NativeMethodAccessorImpl.java:-2)
at sun.reflect.NativeMethodAccessorImpl.invoke(NativeMethodAccessorImpl.java:62)
at sun.reflect.DelegatingMethodAccessorImpl.invoke(DelegatingMethodAccessorImpl.java:43)
at java.lang.reflect.Method.invoke(Method.java:498)
at org.apache.tomcat.util.modeler.BaseModelMBean.getAttribute(BaseModelMBean.java:165)
at com.sun.jmx.interceptor.DefaultMBeanServerInterceptor.getAttribute(DefaultMBeanServerInterceptor.java:647)
at com.sun.jmx.mbeanserver.JmxMBeanServer.getAttribute(JmxMBeanServer.java:678)
at io.micrometer.core.instrument.binder.tomcat.TomcatMetrics.lambda$registerThreadPoolMetrics$2(TomcatMetrics.java:158)
at io.micrometer.core.instrument.binder.tomcat.TomcatMetrics.safeDouble(TomcatMetrics.java:370)
at io.micrometer.core.instrument.binder.tomcat.TomcatMetrics.lambda$registerThreadPoolMetrics$3(TomcatMetrics.java:158)
at io.micrometer.core.instrument.internal.DefaultGauge.value(DefaultGauge.java:53)
at io.micrometer.prometheus.PrometheusMeterRegistry.lambda$newGauge$5(PrometheusMeterRegistry.java:335)
at io.micrometer.prometheus.MicrometerCollector.collect(MicrometerCollector.java:75)
at io.prometheus.client.Collector.collect(Collector.java:46)
at io.prometheus.client.CollectorRegistry$MetricFamilySamplesEnumeration.findNextElement(CollectorRegistry.java:197)
at io.prometheus.client.CollectorRegistry$MetricFamilySamplesEnumeration.nextElement(CollectorRegistry.java:212)
at io.prometheus.client.CollectorRegistry$MetricFamilySamplesEnumeration.nextElement(CollectorRegistry.java:152)
at io.prometheus.client.exporter.common.TextFormat.write004(TextFormat.java:71)
at org.springframework.boot.actuate.metrics.export.prometheus.TextOutputFormat$1.write(TextOutputFormat.java:45)
at org.springframework.boot.actuate.metrics.export.prometheus.PrometheusScrapeEndpoint.scrape(PrometheusScrapeEndpoint.java:62)
at sun.reflect.GeneratedMethodAccessor5358.invoke(null:-1)
at sun.reflect.DelegatingMethodAccessorImpl.invoke(DelegatingMethodAccessorImpl.java:43)
at java.lang.reflect.Method.invoke(Method.java:498)
......

又一个DefaultGauge方法,trace下看看

trace io.micrometer.core.instrument.internal.DefaultGauge value  -n 5 --skipJDKMethod false   '#cost>7000'

筛选耗时7000ms以上的

Affect(class count: 1 , method count: 1) cost in 3703 ms, listenerId: 1
`---ts=2024-07-18 14:53:59;thread_name=http-nio-80-exec-11;id=282;is_daemon=true;priority=5;TCCL=org.springframework.boot.web.embedded.tomcat.TomcatEmbeddedWebappClassLoader@56f72909
`---[3460.320315ms] io.micrometer.core.instrument.internal.DefaultGauge:value()
+---[0.00% 0.102175ms ] java.lang.ref.WeakReference:get() #50
`---[99.99% 3460.108749ms ] java.util.function.ToDoubleFunction:applyAsDouble() #53

`---ts=2024-07-18 14:54:04;thread_name=http-nio-80-exec-11;id=282;is_daemon=true;priority=5;TCCL=org.springframework.boot.web.embedded.tomcat.TomcatEmbeddedWebappClassLoader@56f72909
`---[4706.590702ms] io.micrometer.core.instrument.internal.DefaultGauge:value()
+---[0.00% 0.00449ms ] java.lang.ref.WeakReference:get() #50
`---[100.00% 4706.555963ms ] java.util.function.ToDoubleFunction:applyAsDouble() #53

`---ts=2024-07-18 14:54:05;thread_name=http-nio-80-exec-10;id=117;is_daemon=true;priority=5;TCCL=org.springframework.boot.web.embedded.tomcat.TomcatEmbeddedWebappClassLoader@56f72909
`---[3464.299868ms] io.micrometer.core.instrument.internal.DefaultGauge:value()
+---[0.00% 0.004464ms ] java.lang.ref.WeakReference:get() #50
`---[100.00% 3464.267891ms ] java.util.function.ToDoubleFunction:applyAsDouble() #53

`---ts=2024-07-18 14:54:08;thread_name=http-nio-80-exec-11;id=282;is_daemon=true;priority=5;TCCL=org.springframework.boot.web.embedded.tomcat.TomcatEmbeddedWebappClassLoader@56f72909
`---[3506.58117ms] io.micrometer.core.instrument.internal.DefaultGauge:value()
+---[0.00% 0.004415ms ] java.lang.ref.WeakReference:get() #50
`---[100.00% 3506.550354ms ] java.util.function.ToDoubleFunction:applyAsDouble() #53

Command execution times exceed limit: 5, so command will exit. You can set it with -n option.
`---ts=2024-07-18 14:54:08;thread_name=http-nio-80-exec-10;id=117;is_daemon=true;priority=5;TCCL=org.springframework.boot.web.embedded.tomcat.TomcatEmbeddedWebappClassLoader@56f72909
`---[3507.01059ms] io.micrometer.core.instrument.internal.DefaultGauge:value()
+---[0.00% 0.005822ms ] java.lang.ref.WeakReference:get() #50
`---[100.00% 3506.975301ms ] java.util.function.ToDoubleFunction:applyAsDouble() #53
[arthas@36]$

是一个applyAsDouble方法慢????问题排查到这已经感觉不对劲了。system_cpu_usage的慢也排查了,是一个和这个完全不相关的东西慢。

之后观察上面打日志的截图发现他的指标是一台机器一个样,一台机器一个指标慢,而不是所有的都慢。

花了不少时间没找到具体原因,决定换思路。 先尝试看看问题是从什么时间开始的,结果发现,问题从7月11日开始出现,之前Prometheus指标很稳定,一般在2s左右。

11日发版后:

image-20240722141148588

11日发版前:

image-20240722141217336

排查当日发版代码,但并没有发现能影响到指标的问题。
但是发现了一个异常指标,即服务的线程数不正常,相比其他服务较高,达到1万左右。
image-20240722141353596
分析线程栈发现,80%都为熔断器线程池
image-20240722144748076
此时,灵机一动,是不是改了配置文件的参数导致的?
检查发现,在10号上午,确实改过配置文件熔断器的核心线程数默认值,从20改为了50
image-20240722143237382
配置调整结束后,一切正常。

延展阅读

  1. SpringBoot2.0学习第六篇之Endpoint监控端点扩展
  2. Micrometer Prometheus
  3. Prometheus (prometheus)
  4. Meter Filters
  5. Java中使用Micrometer来实现监控数据的输出
  6. Getting started with resilience4j-micrometer